Improving productivity with E2E visibility in cloud-native applications
Learn about an observability implementation strategy that can help DSPs mitigate implementation challenges and gain efficient observability.
Table of Contents
ToggleAs Digital Service Providers (DSPs) transition towards multi-layered microservices architecture and cloud-native applications, traditional monitoring tools have shown several limitations. It’s difficult to get a unified analysis with scattered monitoring tools. Challenges in correlation and isolation of problems hamper DSPs from delivering on SLA/SLO.
DSPs need to look beyond traditional monitoring and make their digital business more observable, making it easier to comprehend, manage and fix. Gartner defines observability as “the characteristic of software and systems that allows them to be “seen” and allows questions about their behavior to be answered.” Efficient E2E observability implementation provides immediate value to the DSP ecosystem by gaining critical insights into the performance of today’s complex cloud-native environments. Unified visibility across the ecosystem enables powerful analysis by bringing logs, metrics, events, and traces together at scale in a single stack.
Key strategy for an efficient observability implementation
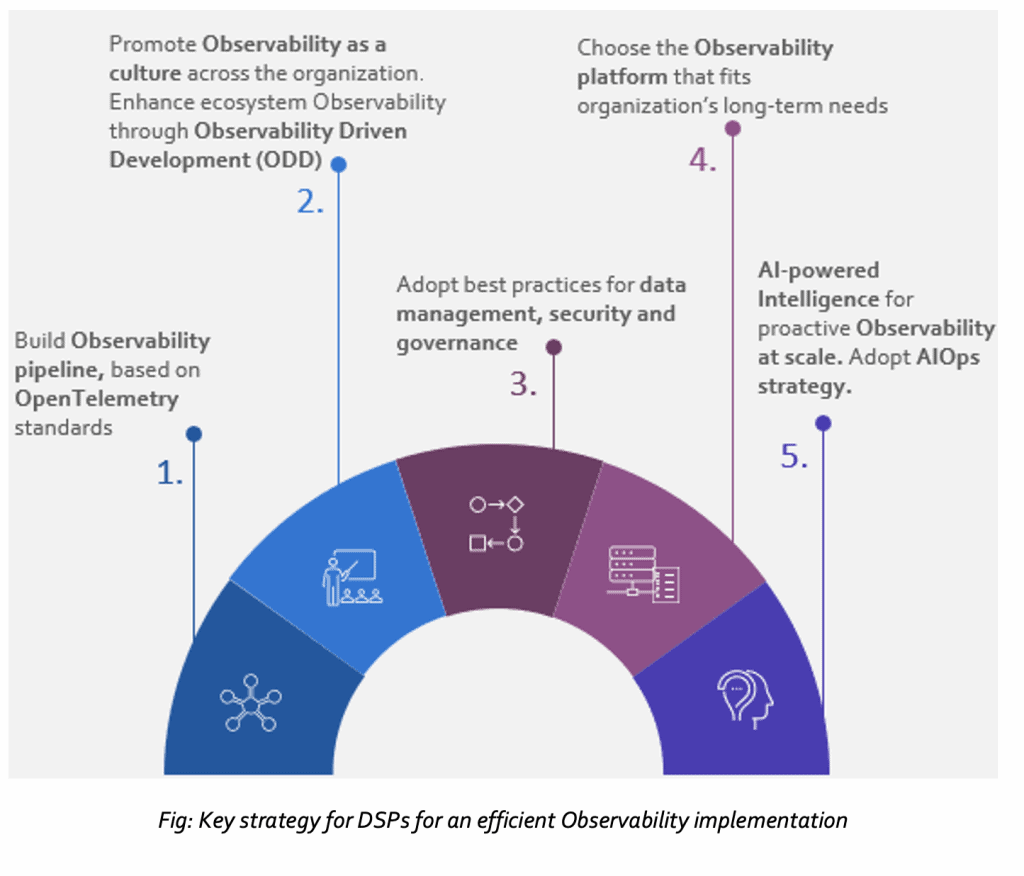
While leading DSPs have started implementing observability techniques, many face various implementation challenges and are not able to realize the actual benefit. The observability implementation strategy detailed below can help DSPs mitigate implementation challenges and gain efficient observability.

Fig: Key strategy for DSPs for an efficient Observability implementation
- Build observability pipeline based on OpenTelemetry
Challenges in observability pipeline
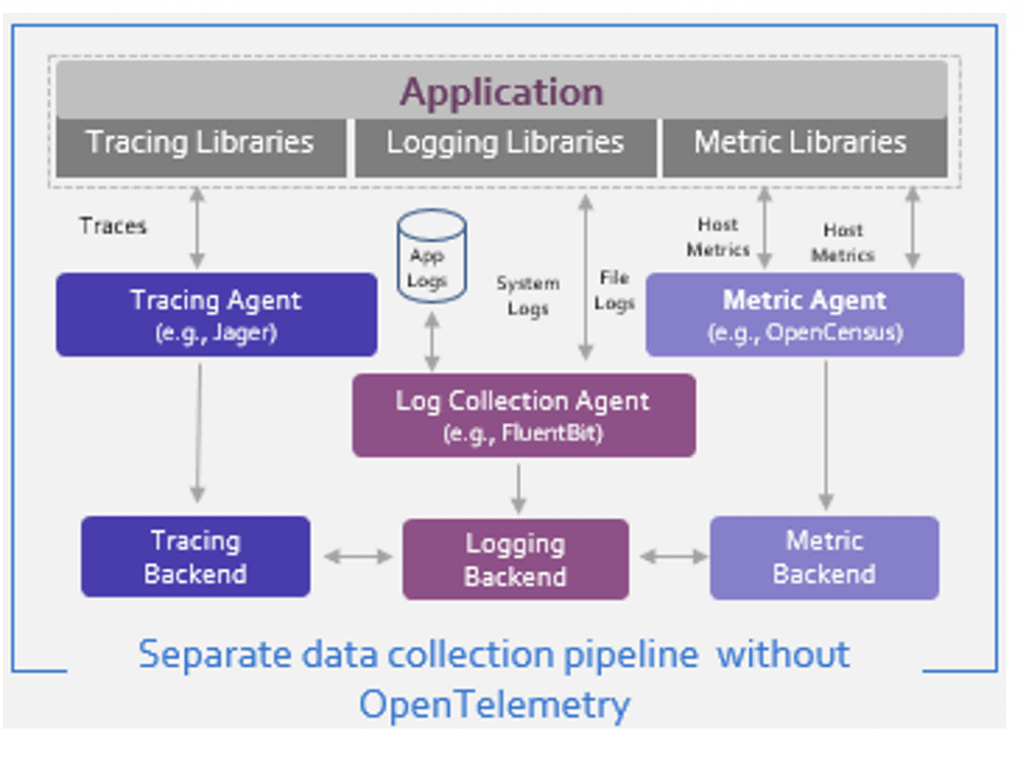
Lack of standardization of telemetry data leads to increased complexity to maintain instrumentation (usage of different agents to collect logs, traces, and metrics). This creates issues with data portability and results in a vendor lock-in scenario. Also, a tighter coupling of collected data with destination forces teams to use scattered toolsets with drawbacks.

Key recommendations
- Build observability pipeline based on OpenTelemetry standards
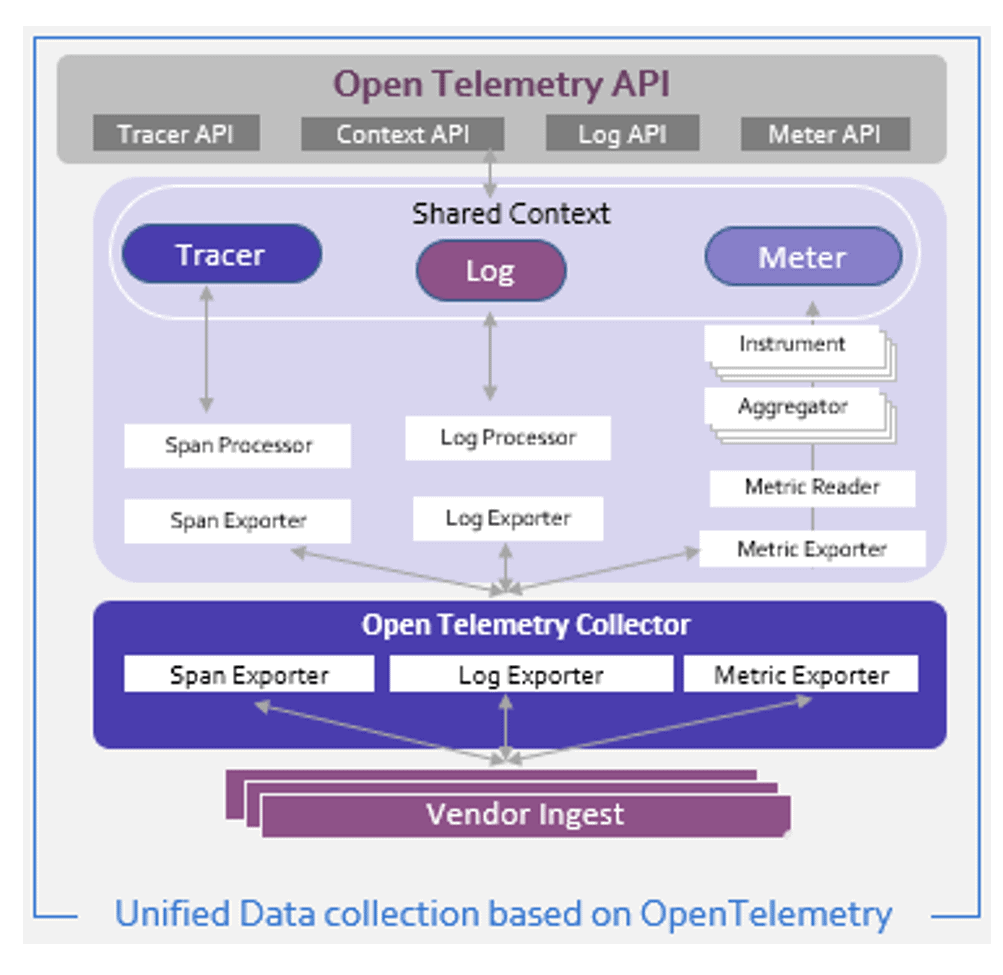
Unified data collection using OpenTelemetry standards decouples the data sources from the destinations and makes the observability data easily consumable.
- OpenTelemetry eases instrumentation for DSPs by providing a single, vendor-agnostic instrumentation library per language and supports automatic and manual instrumentation. It provides a de-facto standard for adding observability to cloud-native applications. Further, as OpenTelemetry gains adoption, more frameworks will include out-of-the-box instrumentation.

- Monitor metrics that really matter
Start with monitoring key metrics that have direct implications on operations and business. It is crucial to establish the baseline list of metrics and optimize it based on the observability learnings. To eliminate any capacity issue, focus only on the data sources that hold real value.
- Ensure standard and structured log management techniques in the logging guidelines
Clearly define logging guidelines that should cover key parameters such as when to log, log name, log format, and log details such as correlation ID, flow ID, event ID, and transaction ID. It becomes essential to log critical data that helps DSPs to troubleshoot performance problems, solve user experience issues, or monitor security-related events. Also, these log levels can be made configurable as it helps to adjust the verbosity of logs and get enough information as needed.
- Capture trace IDs to clearly visualize request flow
This enables DSPs to see how a request flows through the system, irrespective of whether you’re using a service mesh, or a load balancer/proxy.
- Promote observability as a culture across the organization
Challenges
In traditional monitoring, visibility is not a consideration during the design or development phase. As such, the DevOps team is aware of issues only when services fail or are about to fail in predictable ways.
Key Recommendations
- Promote observability as a culture across the organization
Observability as a culture is the degree to which a company values the ability to inspect and understand systems, their workload, and their behavior.
- Ensure Observability Driven Development (ODD) throughout the software development life cycle
In the design phase, determine what to measure based on QoS and KPIs to be met. Also, identify appropriate places where instrumentation needs to be added. The development phase requires standardizing the context and having sufficient context included consistently across all instrumentation data. It is also important to maintain the right balance on the level of instrumentation, or else this can overwhelm analysis. In the build and deployment phase, enforce observability as part of the continuous deployment process. Observe unusual behavior at an early stage through automation. Lastly, in the operate phase, instill continuous feedback of observability learnings from the operations and development team for continuous improvement.
- Adopt best practices for data management, security, and governance
Challenges
Overlogging leads to a situation where log storage capacity is consumed quickly. Lack of retention policies results in quick exhaustion of storage capacity leading to cost increase and operational issues. Also, lack of role-based access and GDPR non-compliance often leads to severe security breaches and penalization.
Key Recommendations
- Centralize and correlate all data sources. Don’t analyze in silos
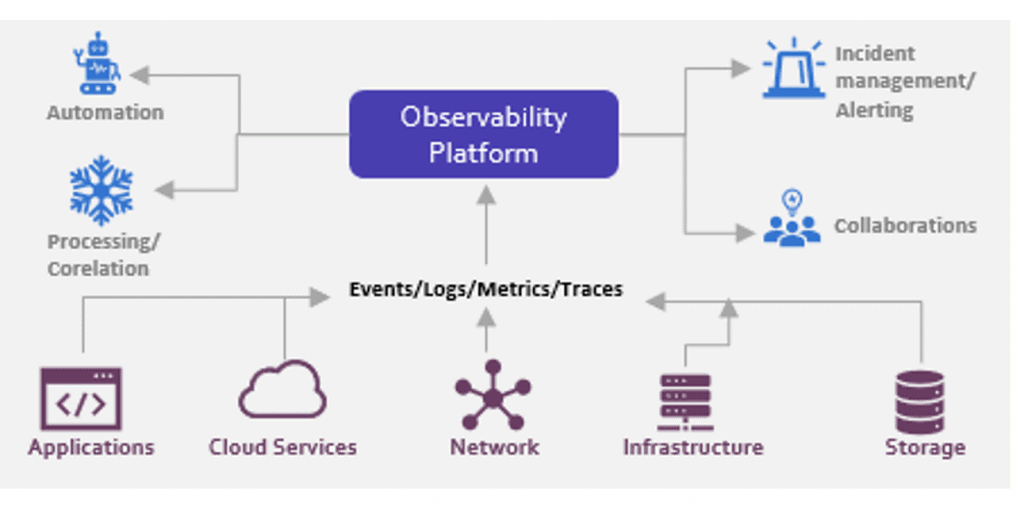
A single pane of view helps to connect dots between captured logs, events, traces, and metrics. This gives the whole story of what’s happening at any point in time. Logs from disparate sources can be collected, parsed, and stored in a central repository with indexing.
- Create a flexible data retention policy
Clearly define the duration of retention for various types of data (e.g., regulatory data, machine state data, etc.). Follow the 3-2-1 rule for storage and backup. Ideally, there should be three copies of the data, stored on two different media, with at least one stored off-site or in the cloud. Log storage must work as a cyclic buffer that deletes the oldest data first when the storage limit is reached.
- Implement security policies for collected data
Role-based access control should be implemented for access to stored data. Make sure sensitive data gets anonymized or encrypted.
- Use stored data (logs) to identify automation opportunities
Logging should be viewed as an enabler for automation in addition to just troubleshooting. Capture where the issues are introduced and what are the sources of these issues to identify an automated fix.
- Choose the observability platform that fits the organization’s long-term needs

Key parameters an observability platform must have:
- Full-stack monitoring (cloud, business, user, applications, infrastructure, network)
- Supports OpenTelemetry (e.g., Elastic, NewRelic, etc.)
- Supports intelligence and AIOps (e.g., Elastic, Dynatrace, AppDynamics, MoogSoft, etc.)
- Ability to correlate metrics, traces, logs, and events to business outcomes
- Real-time analysis (aggregation and visualization)
- AI-powered intelligence for proactive observability at scale. Adopt an AIOps strategy.

AIOps is becoming an embedded capability of observability. Gartner predicts that exclusive use of AIOps and digital experience monitoring tools to monitor applications and infrastructure will rise from 5% in 2018 to 30% in 2023.
DSPs need to prioritize the development of an AIOps strategy. AI-powered observability tool combined with AIOps strategy for observability at scale can simplify the demands of an increasingly complex ecosystem.
Benefits achieved by a leading DSP in Europe after observability implementation
- Increased productivity by 40% with better workflows for debugging and performance optimization.
- 30% improvement in system availability – Observed significant improvements in incident detection and resolution time, increasing reliability to deliver on SLAs and SLOs.
- Improved customer experience with better compliance to business, IT, and infrastructure metrics. Enabled by gaining critical insights into the performance of DSP’s complex cloud-native environment.


