
You have probably seen this term used a lot by business managers, journalists, and financial reporters. Have you ever wondered how we define metrics in business?
The business metrics meaning in business will differ depending on whom you ask. People in different industries have slightly varying opinions.
Still, there is a consensus that the business metrics definition refers to a numerical measurement of some element or elements of a business in business.
What Are Business Metrics?
A business metric’s numerical measure could be on a single data point or a set of data points over some time. It could be financial metrics, customer service metrics, or any other element that can be measured numerically.
Business metrics are quantitative, meaning they measure tangible things. This quality is crucial because it makes business metrics objective instead of being qualitative, which is subjective.
Financial metrics is a good example. A financial metrics definition would be the quantitative measures – such as revenue growth over time – that businesses can use to assess the financial performance of their business.
To put the quantitative quality of business metrics into more familiar terms, consider an automobile. Most car owners are familiar with the metric miles per gallon or MPG. This metric measures the number of miles a car can travel on one gallon of fuel; in the auto industry, MPG is a standard measurement of fuel efficiency.
In business, a common metric is Return on Investment (ROI); the investment gains compared to the investment cost. ROI is an important business metric for investors comparing the returns from two different investments.
We will delve more into business metrics examples later, but with these examples, you can begin to understand what is business metrics.
Business metrics are wide-ranging, and they all share the common attribute of being numerical. Business metrics are also handy at providing context in that they give you insight into how a business is performing on a relative or comparative basis.
Taking our earlier example, assume you run a delivery business with a fleet of trucks and vans. Suppose you have a truck with a fuel efficiency of 15 miles per gallon while a van gives you 20 miles per gallon.
You would not automatically say that the van has better fuel efficiency than the truck because this would be akin to comparing apples to oranges.
To use the miles per gallon metric correctly, you would have to compare a van to a similar van in make and engine size. But, in the context of the entire fleet and on a relative basis, the van has better fuel efficiency than the truck.
But, the analysis of key business metrics works best when done on a comparative basis. And, in case you are wondering what is KPI in business, we explain business KPI and other standard terms that come under the umbrella of business metrics below.
Business Metric or Key Performance Indicator
Many people tend to use the terms Business Metric or Key Performance Indicator (KPI) interchangeably as if they mean the same thing. The term, Key Results, is also sometimes thrown into the mix. The fact is, these three terms don’t mean the same thing.
As already explained above, a business metric refers to the numerical measurement of an element in business. It is a standard for measurement.
The word “measure” is inextricably linked to the definition of business metrics, and this makes sense because historically, the term “metrics” is derived from the Greek word “Metron,” which means “to measure.”
Thus, one can infer that a metric is a tool used to measure something. A business metric always has a current value. For some business metrics, the calculation of the current value may differ from organization to organization.
For example, when calculating the current value of the customer retention rate, the present value can be compared to last month’s figures or the same period the previous year.
There are many ways to derive such a metric. But, whichever method you use to arrive at the current value, it is critical that whoever is looking at it understands the basis of computation.
Metrics are used in both performance indicators and Key Results, which explains the confusion. KPI indicators consist of much more than just a metric.
To set a KPI, a business manager is essentially defining the critical areas of the business. A company’s Key Area is something a manager needs to monitor to ensure its sustained health continually.
A metric and target value is used to indicate the performance of the Key Area. In addition to a metric and a current value, a KPI Key Performance Indicator also consists of the following:
- A targeted value: This is the minimum or maximum value that the metric should have.
- A title: the title consists of the metric and the target value. The current value is displayed above the target value.
The above is all the information someone needs to see what the KPI is and determine if it’s within acceptable parameters.
A KPI defines the “business as usual” standard and enables management to monitor performance easily.
Key results belong to an objective. They kill two birds with one stone. Specifically, they remove ambiguity by clarifying and quantifying what a successful goal looks like and measuring progress towards the goal.
An objective usually has two to three Key Results. Each Key Result is designed to impact a specific metric positively. The structure of a Key Result is comparable to that of a KPI.
The only exception is that it always has a target value that is different from the targeted amount. It is designed to impact a specific metric positively. In addition to a metric and a current value, a Key Result also comprises the following:
- A starting value: this is the value that your metric has at the start of a specific time frame.
- A targeted value: This is the value you want the metric to have at the end of the time frame.
- A title: An excellent Key Result title bundles all the Key Result components, for example, “Increase Customer Retention rate from 80% to 90% within 6 months“. In this example, the business metric is the customer retention rate, the starting value is 80%, and the targeted value is 90%.
A KPI and a Key Result are structurally different and serve different purposes. It is, therefore, important not to use these terms interchangeably. But, it is vital to note that it is possible for the business metric used in a KPI also to be used in a Key Result. For example, when the KPI is above or below its target value.
Importance of Business Metrics
Why are metrics important in business? A lot of managers are confused by metrics. They don’t understand which metric to use and why. The critical thing about metrics is to understand they aren’t the goal. It’s a way to measure your progress towards the goal.
Most importantly, for metrics to make sense to a company, you must measure the right things. The fictional story below illustrates how important it is to ensure you measure the right thing.
Once you measure the right stuff, you need to manage the numbers because they drive everything in a company. Failure to have a complete understanding of your numbers means you are clueless about how your business is doing.
Business Metrics Objective: Track Performance
The first importance of metrics in business is to track performance. You can’t manage a business from your checkbook. Think about it, when you watch a football game, how do you know who is winning or losing?
The answer is in the scoreboard; it tells you the actual score, the time remaining, and lots more information about the game. It’s the same in your business. Your business’s primary scoreboard is your profit and loss, balance sheet, and cash flow projection.
Profit and loss statements are great for comparison. They help you measure the progress in your business. For example, you can compare this quarter’s performance with the previous quarter or the current quarter with the same quarter last year.
The balance sheet is also a useful tool for comparison and works as a snapshot in time. It captures a specific fiscal date, such as the year ending on 31st December. Failure to use these tools means you are not tracking the performance of your business.
The problem with the balance sheet and profit and loss statement is that they are historical. These tools tell you what has already happened. On the other hand, a cash flow projection is forward-looking.
It takes data from the profit and loss statement except for depreciation and amortization and adds the debt payments to see the business’s cash position will look like in the future.
Many business managers ignore their scoreboards. They practically run their business by relying on their instincts, without a clear plan, and hoping they are winning the game.
The truth is that many business managers are playing a guessing game with the future of their business. A pilot must be able to read the instruments on the dashboard.
He may be able to get by on a clear sunny day, but in the event of a storm, the probability of crashing increases massively when you take away the instruments. It is the business manager’s responsibility to know how to read the various tools available to them.
Control and Feedback
The ideal state in a business is arrived at by looking at historical metrics or examining competitor analytics. This desired state is then expressed in terms of metrics because business metrics are the numbers that are being measured daily.
Contemporary management philosophy states that you have to measure something for you to manage it. Thus, metrics let you know whether a process is working as intended or requires intervention. Business metrics, therefore, form the control basis in any company.
Objectivity
Due to their numerical nature, business metrics eliminate ambiguity and vagueness in a business process. Metrics help transform the vague requirements given by customers. These requirements are converted into numbers and used to map the process accurately. Metrics tell managers whether a process meets the customer’s requirements or needs improvement.

Goal Improvement
For objectivity in the improvement of goals, they must be measured in numerical terms. Bandying around words such as “low quality,” “high quality,” and “acceptable” tends to vagueness and often depends on the subjective personal opinion of the person making those statements. Therefore, help with comparison by converting both the customer requirements and operational performance to numbers.
Let’s visit the issue of KPIs because they also help answer the all-important question, “Why are KPIs important to a business?”
Why is KPI Important?
A Key Performance Indicator is a vital area of the business that a manager must continuously pay attention to. Why are KPI important? They are essential because failure to meet the targeted value has negative consequences for the business; in some cases, instantaneously.
For example, small business KPIs in the e-commerce industry would include conversion rate, shopping cart abandonment rate, churn rate, and much more.
A conversion rate is an important KPI for business. It if suddenly drops below the targeted value, this is an indicator that something is wrong. Likewise, a higher shopping cart abandonment rate than the industry norm indicates some bad experience in the checkout process.
KPIs are invaluable for focusing employees’ attention on what is important. This concept is captured in several cliches that you find in the management world, such as Peter Drucker’s famous quote, “What gets measured gets done.” Visibly counting something prompts people to change their behavior.
Another renowned cliche is, “If you don’t measure results, you can’t tell success from failure,” and thus, you can’t claim or reward success or avoid unintentionally rewarding failure. The news is full of examples of financial companies or other types of companies measuring the wrong things and motivating improper behavior.
Another similar saying in management is, “If you can’t recognize success, you can’t learn from it,” and “If you can’t recognize failure, you can’t correct it.”
Measurement is a fundamental aspect of good management. Simply put, if you don’t measure your work, you’re not managing it.
Examples of Business Metrics
KPIs can be leading or lagging in nature. Lagging indicators are those that indicate past performance and tend to focus on the long-term results that you are trying to achieve.
Leading indicators predict future success. It’s crucial to balance these indicators, as you want to understand if you’re achieving your goals and improving the factors you believe will drive future success.
Leading indicators and lagging indicators are relative terms. Let’s take a non-business example to help you better understand this concept. The number of smoking cessation programs run by the US Department of Health and Human Services could be considered a lagging indicator of the population’s percentage that smokes cigarettes.
On the other hand, the population that smokes cigarettes could be regarded as a leading indicator of long-term cancer rates. The fact that these terms are relative can confuse some people, but it’s imperative to learn because it is fundamental to managing strategic performance.
We will explain more on business metrics dashboards in the next section.

Examples of Leading Indicators in Business
Every industry is unique, so there are numerous examples of leading indicators in business. Below are the leading indicators that cut across most industries.
- % Growth in Sales Pipeline Metrics
- % Growth in New Markets
- The number of New Patents
- The Number of New Website Trials
- The number of Unique Website Views
Examples of Lagging Indicators in Business
Let’s now examine a few examples of lagging indicators in a business. As mentioned, lagging indicators record actual historical performance and are therefore common in business plans.
Example of key metrics in a business plan:
- Sales Revenue
- Gross Margin
- Net Profit Margin
- Earnings Before Interest Tax, Depreciation, and Amortization (EBITDA)
- Growth in Annual Sales
Business Metrics Dashboard
In the traditional sense, a dashboard is a panel containing various instruments through which a vehicle driver or airline pilot applies controls and has a clear understanding of the engine and accessories’ performance.
The business world borrowed the term to refer to a tool that displays the performance measurement of a series of set objectives. The output is usually displayed in one window, screen, or page on a computer or mobile device, and the user can see several metrics at a glance.
This quality makes it useful to gather quick, actionable insights into what is happening in the business.
The objectives may vary depending on the project and the organization. For instance:
- An ad agency may measure the performance of its paid campaigns.
- A web development firm may track the progress of client work on a business metrics dashboard.
A business metric dashboard contains visual tools that make it easy for all stakeholders to use it. Some of the stakeholders that rely on business metrics dashboards include:
- C-Suite Executives
- Venture Capitalists (VCs)
- Investors
- Employees
A useful dashboard gives you much information within a short time and space. Visual tools highlight information in an easy-to-understand manner. Progress gets tracked in a few diagrams. There is no jargon to cloud the truth but a clear, easy-to-use method to let you know whether you are on the right track.
There is no doubt that when running a business, tracking progress via a dashboard is a necessity. It is the only way to have a clear view of an organization.
Whether you are the CEO, a VC, or an investor, you can learn a lot by looking at the dashboard, and it ensures you make an informed decision.
A business metrics dashboard brings out the best of all employees by focusing attention on the key areas.
The benefits of using a business metrics dashboard can, therefore, be summarized as follows:
- Increased focus
- Improved performance
- Reduces time wastage
Best KPI Tableau Dashboard
A Key performance indicator (KPI) is a crucial aspect when you measure performance. To do that effectively, you need to use the best KPI tableau dashboards.
A KPI tableau dashboard enables you to highlight KPIs within the dashboard easily. Many business executives use a KPI tableau dashboard to track sales performance metrics and improve their managerial performance.
The features in a KPI tableau dashboard make it easy to manage workflow, accentuates your role as a manager, and lets you focus on your job’s most critical aspect.
With a KPI tableau dashboard, you know whether you are hitting your targets by merely looking at a screen or page. This challenges you to fix your weak spots and bring your “A game.”
From projected sales to profits, the best KPI tableau dashboard enables you to track them in real-time. You don’t wait for secondary sources of information when you can get it first hand.
A KPI tableau dashboard definitely comes in handy when running an organization. You know whether your goals are getting accomplished or not – there is no guesswork since you measure performance in real-time.
Business KPI Dashboard
A business is all about identifying a problem, solving it, and making money as a consequence. A business KPI dashboard provides you with an at-glance-view of what matters to your business and helps you focus on the big picture.
You get to look at the parameters that matter, such as potential leads and how to convert them, market share, and various projections.
For your business to grow, you need to track new products and their performance in the market. With the data you obtain, you can decide what to tweak and take highly targeted actions that impact business performance positively.
With consumer insights gleaned from the business KPI dashboard, you can improve your business to meet customer needs.
Having a business KPI dashboard enables you to use the data you have to your advantage. Many firms have troves of information about their business but don’t get to use it to improve their bottom line because they don’t have a clear view of their data.
Startup KPI Dashboard
According to the US Small Business Administration, 20% of start-ups fail in the first year. Building a business from scratch is hard work. To succeed, a lot of work needs to get done.
You need to focus on the productive areas that deliver the highest returns. The only way to focus on the important stuff is to use a start-up KPI dashboard.
With a start-up, you are setting things up. Everything from the business structure to the company culture is non-existent. Having a transparent system increases the odds of success.
The start-up KPI dashboard is a chance not to be a statistic but a great start-up. You track your growth from a nascent idea through steady growth in the market and to success.
Some of the business metrics you can track with a start-up KPI dashboard include:
- Revenue Growth Rate
- Churn Rate
- Burn Rate
- Activation Rate
- Daily Active Users to Active Monthly Users Ratio
If you have received seed funding and want to qualify for the next round of funding, you must have all ducks in a row. A start-up KPI dashboard can help convince investors that you deserve additional funds.
Additionally, a start-up KPI dashboard keeps you on your toes by keeping you focused on your business’s key areas. With the clarity of the current state of your business, you know what to improve.
Business Metrics Component: Company Metrics Dashboard
Every company wants to make tons of money, but not many get to do that. In the same industry, you can have one business minting money and another struggling to survive.
A company metrics dashboard often tells the story that sets apart businesses in the same industry.
Efficiency happens to be one of the critical factors in the success of a business. Being able to do something well at scale provides an unassailable lead in the market. But how do you do that?
You need to ensure that your business is improving its operations daily. It needs growth.
A company metrics dashboard ensures you have a bird’s eye view of all your business processes. Why should it take a product 24 hours to be delivered? Maybe you can cut that time in half if you get to fix a flaw in the process.
A company metrics dashboard provides you with the actionable insights you need to make rational decisions and streamline your operations where you see a gap.
Running a business is a tough job. Having a useful tool to help you run it makes the job a little easier but worth it. You can get more with the same resources you had before.
With a company metrics dashboard, managers don’t need to hold briefing meetings and spend more time on productive work. This saves time and money in the long run.
A company metrics dashboard enables you to stay on top of things. You know how far a project has gone, the challenges it’s facing, and put out small fires before they spread.
Different Types of Business Metrics
Managers must pay attention to the right factors when gauging business performance. There are many things to consider when running a business. You have to steady the ship and guide it towards profitability.
If you know what to look out for, you are on the right path. With the different types of business metrics available, you get to look at your business through the right lens.
Below are some standard terms regarding the different types of metrics in business.
Key SaaS Metrics
Software as a Service (SaaS) refers to the process of offering software on demand through a web server as opposed to downloading a program on a local machine. The growth of network computing power and faster Internet has led to SaaS’s exponential growth over the last decade.
Running a SaaS firm is both exciting and challenging. But what are some of the key SaaS operating metrics to watch when running such a business? Below is a summary of typical Saas operating metrics:
- Lifetime Customer Value
- Qualified Marketing Traffic
- Customer Health Score
- Revenue Churn Rate
- Customer Churn Rate
Key Metrics in Business Plan
It’s often been said that a fool with a plan always beats a genius without one. A business plan is an absolute necessity for a startup. It is a roadmap that guides you and forces you to ask yourself tough questions and demonstrate its viability. It is how you begin to move from a mere idea to making your entrepreneurial dreams a reality.
What are the key metrics business plan issues considered most important? The key metrics to look out for in a business plan are:
- Sales Revenue
- Net Profit Margin
- Customer Acquisition Cost
- Monthly Profit/Loss
- Overhead Costs
- Inventory Costs
Even industry has certain benchmarks with regard to these metrics. These benchmarks are a map to guide you in unfamiliar territory. You should pay attention to what the plan is saying to ensure business success.
Once you start the business, you should always refer to the business plan and take corrective action whenever you deviate from your plan’s key metrics.
Business Development Metrics
Business development metrics measure the growth rate in critical areas of your business as opposed to business plan metrics that are a roadmap.
Business development metrics force you to ask yourself and your team tough questions. What can be done better? With these metrics, you can benchmark yourself against the competition or industry and make positive changes to your business.
Some examples of business development metrics include:
- Sales growth
- Employee productivity
- Market share
- Operational efficiency
- Conversion rate
- Gross Margin KPI
Company Metrics and Growth Metrics
There are numerous other business metrics that don’t fall into any of the categories we have already mentioned. They complement those already discussed, and some are unique to particular industries. We will discuss many of these other company metrics and growth metrics in subsequent sections.
Business Metrics Subset: Operational Metrics
Operational metrics are KPIs that give you a bird’s eye view of your business in real-time. They calculate the operational aspects of your business. Operational aspects have to do with processes, people, and systems. You can quickly see what’s veering off course and take corrective action.
With operational metrics, you are like a commander overseeing a military operation in real-time.
The advantages of using operational metrics include:
- Quickly tell when things are going wrong when the metric deviates from the targeted value.
- Stay on top of things and proactively manage the business.
- Keep everyone focused on what matters and reduce or eliminate time-wasting.
- Get actionable insights in real-time to improve your business continuously.
Operational Efficiency Metrics
As the name implies, operational efficiency metrics gauge the level of efficiency of your systems, processes, and human resources.
With operational efficiency metrics, you can see whether the policies put in place impact the business positively.
Operational efficiency metrics are often used during testing, and with feedback, efficient processes and systems are rolled out across the entire organization.
Operational Performance Metrics
Operational performance refers to aligning all core business units to ensure they are working towards attaining the same goals. There are seven main operational performance objectives in any business; these are:
- Efficiency
- Productivity
- Quality
- Speed
- Dependability
- Flexibility
- Cost
Operational performance metrics refer to any metric that measures any of the above objectives.

Key Operating Metrics
Several key operating metrics help you gauge the operational performance of your business. These form the foundation of your operational performance review. Below are a few key operational metrics examples:
- Cost per click (CPC)
- Cost per acquisition (CPA)
- Lead conversion ratio
- Lead to opportunity ratio
- Order status
- Sales by Region
- Absenteeism Rate
- Overtime Hours
- Delivery Time
- Transportation
- Total Tickets vs. Open Tickets
- Average Handle Time
- Revenue per employee
Operational Metrics vs KPI
Operational metrics focus on the present situation, while KPIs usually focus on the future. Operational metrics focus on ensuring proper day-to-day running and that the business remains a ongoing concern.
Key Performance Indicators (KPIs) look beyond the present. They aim to ensure future goals are on track. KPIs are there to remind you there is more to running a business than operational metrics. Operational metrics are necessary to propel your KPIs to reality.
RPA Operational Metrics
RPA is an abbreviation for Robotic Process Automation. RPA is all about automating business operations by eliminating errors attributed to humans; RPA infuses accuracy.
RPA also solves the problem of repetitive tasks performed by humans do. It enhances efficiency in the business by getting more work is done in a shorter time.
Furthermore, some downtime is inevitable when a process is run entirely by humans because fatigue or boredom sets in at some point, but with a proper RPA system in place, work goes on non-stop.
RPA operational metrics show where RPA has the most impact, helps you plan future roll-out, and helps track your return on investment.
Below are examples of RPA Operational Metrics:
- Accuracy
- Employee retention rate
- Employee satisfaction rate
- The proportion of digitized audit trail
- The number of compliance deficiencies or errors
- New projects undertaken
- Process velocity
Operational Metrics Tracking
Operational metrics tracking is done through a dashboard. Depending on the requirements, you can get one from a vendor or order a custom-built one. It is advisable to have a cloud-based dashboard to 100% uptime and accessibility.
An operational metrics tracking dashboard on the cloud is a live reporting tool. It allows you to track the business operations on the sidelines of that conference or Uber ride to the airport.
A good operational metrics system is user-friendly, intuitive, and allows you to run quick reports that you can use to garner actionable insights.
Customer Metrics
Have you ever experienced an exceptional customer experience? Maybe at a local business, restaurant, a clothing retailer, or your favorite coffee shop. So impressive to the point where you decided to take a selfie and share it on social media?
Many people have experienced fantastic customer service that turned them from casual shoppers to brand-loyal ambassadors. So why is it that each year roughly one million businesses go out of business?
Is it because of the competition as failed companies would have us believe, or is it just that the competitor was better at their marketing and sales techniques? In a good number of cases, the reasons for business failure lie in the inability to deliver exceptional customer experiences every day.
And it starts at the executive level. The problem with most businesses is that they don’t measure customer success metrics and customer service metrics right at the very top. Most companies tend to focus on financial, sales, and marketing metrics, which show whether the company is making or saving money.
This focus tends to hurt the customer experience because the customer is not a priority. You are what you measure; you have to look at the people’s priorities within the business to understand what those measurements are and why they aren’t helping customer experience.
When metrics that focus on the customer are implemented across the business, the company culture changes, and the quality of products and services improves. This is inevitable because every person’s job has an impact on the customer experience, whether an employee realizes it or not.
For example, in a bakery, it’s not just the person selling the cake to you that can shape the customer experience, even the baker baking the cake and the person who bought the ingredients, and the person who created the recipe all influence your experience. It’s not just the front-line worker. A lot of people behind the scenes impact customer experience.
So, which customer experience metrics are you using to measure this, and what are the priorities put in place by each employee? Below, we examine what types of metrics measure customer satisfaction.

Customer Churn Rate
This is one of many customer satisfaction metrics that measure customers’ loss in one period compared to a previous period. In subscription-based companies, this business metric is sometimes referred to as logo churn or account churn.
MRR (Monthly Recurring Revenue) Churn Rate
This is the amount of revenue lost in one period compared to a previous period. This is a critical customer metric that shows how many more or fewer products/services you sold to customers. You may increase customers, but revenue falls because some customers may have downgraded their products.
A good example is an Over the Top (OTT) company like Netflix. An increase in subscribers doesn’t automatically mean income growth. MRR churn rate shows accurate revenue levels. It is best to have a 30-day rolling average so that you can see the trend.
Net MRR (Monthly Recurring Revenue) Churn Rate
This customer satisfaction metric shows the churn in Monthly recurring revenue without including any expansion revenue. This tells you if customers are sticking around with their payments and making sure they are getting ongoing value from your product.
Expansion MRR Rate
Expansion revenue for many businesses is a new concept, especially subscription-based businesses. Essentially, it is the idea that if a customer starts on a $50 monthly plan, over the lifetime of that account, how much additional revenue do they add on.
Many subscription-based businesses have to figure out their packaging, pricing, and plans and make sure they have value or add-on metrics. This metric makes it easy to understand the expansion revenue monthly.
Net Promoter Score (NPS)
This metric was developed and is owned by Fred Reichheld, Bain & Company, and Satmetrix. They found a correlation between asking a particular question and the scores and results associated with that question. This was linked to whether a company would grow or shrink. It is, therefore, sometimes known as the growth score.
These customer engagement metrics score customers on a scale of 1 to 10 on the likelihood of a customer recommending the business to another person. Customers are asked just one question, “On a scale of zero to 10, how likely is it that you would recommend us to a friend or colleague?” It’s a simple question but a handy measure of customer sentiment to let you know what customers think of your business.
Those with a score of 9 to 10 are regarded as promoters, those with a score of 0 to 6 are detractors, while those in between are referred to as passives.
Detractors have a negative view of the organization. Passives are relatively neutral – they won’t leave the organization abruptly but won’t tell other people about it. Promoters are happy to recommend the business to a friend or colleague and be confident that they would have a good experience.
Net promoter score is an excellent customer metric because it’s about the organization as a whole. It’s great for customer attention and acquisition.

Customer Satisfaction Score (CSAT)
Also known as CSAT, it is arrived at after customers have had some kind of interaction with the business. This score can be computed using post-support questions. Answers are scored on a scale of 1 to 5, with 1 denoting dissatisfaction and 5 indicating satisfaction.
It is a flexible metric that can examine relationships and look into the detail of individual transactions. It is simple for customers to answer and simple enough for the staff to understand the responses and get actionable insights.
Customer Experience Score (CES)
A customer’s journey has multiple steps, all with distinct phases. This metric helps you monitor the experience a customer has at each stage. Typically, customers will be asked to provide feedback on a scale of 1 to 5, with 5 denoting a great experience.
Like CSAT, it is flexible and straightforward to implement. It is great for short, self-contained interactions, such as finding out how easy it was for a customer to get assistance with a delayed order. It is also a very customer-centric metric, unlike the NPS. It focuses on what the customer wants you to be good at rather than what you want to know.
The only disadvantage is that it is process-oriented rather than focusing on making customers happier. Better processes do not always translate into happier customers.
New Customer Acquisition Metrics
Finally, a discussion of customer metrics is incomplete without delving into metrics to measure customer acquisition. There are two main metrics for customer acquisition that every business should track – Customer Acquisition Cost metrics (CAC) and Customer Lifetime Value metrics (CLV).
Marketing Metrics
Marketing is the aggregate of all effort a business puts into facilitating sales; this is done through various means, channels, and media.
Examples of marketing activities include advertising, public relations, blogger outreach, blogging, events, press releases, social media posts, influencer marketing, content marketing, inbound marketing, etc.
Marketing metrics are indicators of how various elements of marketing activities are performing. Below are several common marketing metrics and terms:
- Conversion Rate
- Qualified Leads
- Monthly Recurring Revenue (MRR)
Marketing Profitability Metrics
These metrics assess whether your marketing efforts are paying off or not and allow you to make comparisons between different business units or companies. To examples of marketing profitability metrics include:
- Marketing return on sales
- Marketing return on investment
Growth Marketing Metrics
Growth marketing metrics give you instant feedback on your efforts. Many customer service metrics, such as customer lifetime value (CTL), Net Promoter Score (NPS), customer satisfaction rate, and customer retention rate, are also growth marketing metrics. Below are a few more we haven’t already mentioned:
- Average lead close rate
- Monthly goals by channel
- Click-through rate (CTR)
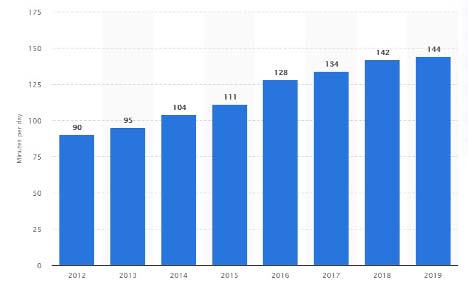
(Image source: Statista.com)
Digital Marketing Metrics
In 2019, Internet users spent 144 minutes online daily on average. In 2021, at least 2 billion people are expected to do their shopping online. And, the COVID-19 pandemic has only catalyzed the transition to online sales.
It is a massive opportunity with a high potential to increase your revenues.
Below are a few some metrics in the digital marketing arena that entrepreneurs need to quickly acquaint themselves with to take full advantage of this paradigm shift.
- Visitor time
- Bounce rate
- Content Shared
- Comments
- Traffic Sources
Sales Metrics
Let’s now consider sales metrics KPIs. Sales are the lifeblood of all businesses and a prerequisite for continuity. Therefore, while metrics are essential in all aspects of a company, they are especially important in sales.
They are used to track goal attainment across business units, products, and regions. Additionally, they track sales staff’s compensation, design incentives, and make strategic decisions.
Below are some of the most common and best sales metrics to track.
Email Sales Metrics
Email is one of the earliest forms of digital marketing, yet it consistently delivers the highest return on investment than any other digital marketing channel.
Email sales metrics include:
- Opens
- Response rate
- The engagement rate
- The conversion ratio
Social Media Metrics
Social media metrics can be confusing. It seems like there is a new metric every week. The important thing is understanding what the sales growth metrics are telling you and translating that back into your business.
Social media metrics fall broadly into five categories, as follows:
- Engagement metrics
- Awareness metrics
- Share of Voice metrics
- Return on Investment (ROI) metrics
- Customer Care metrics
Inside Sales Call Metrics
Of course, sales are often made over the phone, making inside sales call metrics extremely important to track. They include:
- Average number of calls to close a deal
- Revenue from call source
- Average conversations per day
- Percentage of leads contacted
- Dials to closure ratio
Sales Operations Metrics Dashboard
A sales operations metrics dashboard provides a business with all the key sales metrics at a glance. If you’re trying to find a solution to track and measure your sales operations, you have three options:
- Create your dashboard using a spreadsheet program
- Download a free spreadsheet template and customize it
- Invest in a professional cloud dashboard
Business Performance Metrics
Business performance metrics are the totality of all measures of how a business performs at a given point in time. This final section will touch on ratios as business performance indicators.
Categories and Types of Ratio
Ratio analysis is a way of assessing a company’s year-on-year performance, assessing performance against targets, and benchmarking performance against competitors’ performance. Hence, there are different business analyst performance metrics that help us with performance assessment.
- Profitability ratios
- Working capital ratios
- Liquidity ratios
- Solvency ratios
Let’s now consider the key business performance metrics in more detail.
Key Indicators of Profitability
- Return on capital employed (ROCE): This business KPI measures the profitability of a company’s operations and assesses the extent to which a business is achieving a return on its long term capital. The ratio must be sufficient to enable the business to meet its obligations and provide for future growth.
- Sales margin: Measures the operating profit generated from each dollar of sales and assesses whether operating margins are improving or declining. If operating margins are being squeezed, it can prompt management to either raise selling prices or reduce operating costs, or both.
- Gross margin: This measures how much profit has been generated from each dollar of sales before considering indirect costs and assesses whether direct costs are being controlled.
- Asset turnover: This business metric measures the productive use of assets to generate sales and assesses the extent to which assets are being usefully employed or underutilized. Adverse movement in the ratio may suggest that assets are being underutilized.
- Return on Equity (ROE): Measures the return on shareholder’s equity and assesses the extent to which a business is achieving a return on the capital invested by shareholders.

Key Indicators of Working Capital
- Inventory Days: Inventory days is a measure of how many days, on average, a company’s products are in the warehouse and assesses how much cash is tied up in inventory. Ideally, this ratio needs to be relatively low. But driving them down too low may be detrimental as inventory holding may play a significant role in attracting customers. If inventory days are too long, it may be necessary to reduce inventory to free up cash. The key is to strike the right balance.
- Receivable days: Receivables days measure how many days, on average, it takes to receive payment from customers on assesses how much cash is tied up with customers. Ideally, this ratio needs to below, but credit terms to customers may be necessary to seal the deal.
- Payables days: Measures how many days on average it takes to pay suppliers and assesses how much of a company’s suppliers’ cash has been tied up. Ideally, this ratio needs to be relatively high. However, payments must be made within the agreed terms.
Key Indicators of Liquidity
- Current ratio: The current ratio appraises a company’s ability to pay back its short-term liabilities with its short-term assets and assess its financial health. A figure above one indicates a reasonable ability, and a low figure suggests a business may be unable to pay its bills in the future.
- Quick ratio: This is a more rigorous assessment of a company’s ability to pay its short term liabilities. Even if most of a company’s inventory is in the form of finished goods, there is no guarantee that there is a demand for it and, therefore, no certainty how long it will take to be converted into cash. The quick ratio gets around this problem by deducting inventory from current assets. As such, this ratio is good to use to assess a company’s financial health when its inventory is large and challenging to convert into cash.
Key Indicators of Solvency
- Gearing ratio: The gearing ratio compares a company’s external funding with that invested in it by shareholders. A relatively low ratio is desirable as this will provide scope for further borrowing if required, and a high gearing ratio may cause problems if a business experiences a decline in demand for its goods or services. However, a low gearing ratio may not necessarily be to a company’s advantage. A reluctance to borrow may result in the business missing out on investment opportunities.
- Debt-to-assets ratio: This metric is less commonly used than the gearing ratio but substitutes total assets for equity in its calculation. It measures the extent to which the book value of its assets covers a company’s borrowings and assesses whether the debt level is reasonable in relation to the value of a company’s assets. A lender would, therefore, be more comfortable with a low ratio.
- Interest cover ratio: Indicates how well placed on business is to meet interest payments on borrowings and assesses a company’s ability to meet interest payments. A lender would therefore like to see a high a ratio as possible.
Also Asked
What is another word for metrics?
Business metrics are also known as key performance indicators (KPIs). Metrics measure the progress of business values and usually tracked via a business metrics dashboard.
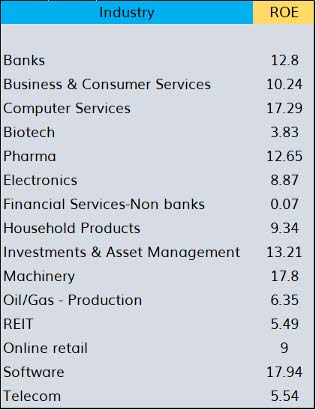
What is another word for Benchmark?
Benchmark is a standard or point of reference that a company can compare itself with. For example, sector comparisons for return on equity (ROE) are as shown below.
What’s another word for performance?
Performance is achieving set goals. For example, a business can be said to be performing when it continuously hits its financial targets.
How do I get business metrics?
Business metrics are calculated. You can get metrics from the tool, a spreadsheet, or a software program you use to measure and track.
What are your top 3 key performance indicators?
Every business is different. The top performance indicators for one company may not be appropriate for another. It all depends on what the firm considers its most critical areas. The metrics that measure performance in these key areas are the top performance indicators.
What are the metrics of quality?
Quality metrics are used to ensure that customers received products that are fit for purpose. They translate customer needs into acceptable measures of performance for processes and products.
How many KPIs should a company have?
There is no limit to the number of KPIs that a company should have. However, the general rule is to have two to three KPIs per objective to have some variety without feeling overwhelmed. Two to three is a good number because every business objective has at least one leading indicator and one lagging indicator.
How many metrics should a company have?
A company can have as many metrics as practically possible though the rule is to have two to three metrics for each objective. This ensures you have enough variety without being bombarded with too much information that you can hardly make sense of it.