
Today, HR reporting is crucial. HR reports provide both quantitative and qualitative information on employees, HR practices, and company trends – and this information is vital for informed decision making. Why? Because it’s almost impossible to make informed business decisions when HR stakeholders lack insight into their own organization.
When done correctly, HR reporting solves this problem, producing the key metrics required to gain insights into the state of the organization and uncover where improvements need to be made. How? Well, regular HR reporting enables both HR and management to keep their fingers on the organization’s pulse by tracking key workforce metrics. For example, the sales department may be struggling with high turnover rates or high time-to-hire rates, indicating that more emphasis needs to be placed on retaining employees. But if no one’s tracking the figures (i.e. the organization’s HR reporting is inadequate), then such a problem may only reveal itself after it’s too late – when the sales department is so undertrained and understaffed that sales (and thereby revenues and profits) are plummeting through the floor.
With HR reporting, new trends and opportunities can be spotted early on, and emerging problems can be addressed before they significantly impact the business. As well as identifying employee turnover patters, HR reporting helps companies make better hiring decisions, forecast hiring requirements, track employee performance, discover the root causes key issues (including high turnover rates and poor employee performance), as well as issues pertaining to costs – cost of absence, cost of labor, training costs, and, of course, recruitment costs.
HR Reporting – What Metrics Should Companies Be Tracking?
To deliver value from HR, it’s important to track the right metrics. Most companies will do some form of standard HR reporting, recording things like average length of employee placements, average salaries, average number of vacation days per employee, average number of unpaid leave days per employee, number of new starters, etc.
These metrics are easy to measure – which is why most companies measure them. However, they don’t really deliver much in the way of business-critical insights that have a direct link to organizational strategy.
Effective HR reporting should illustrate precisely how HR is contributing to the rest of the organization, which means that the metrics tracked should measure how successful HR is in realizing the organization’s business goals.
So, what are the must-have reports companies need to deliver value from HR? Let’s put together a (non-exhaustive) list.
Revenue Per Employee
An organization’s workforce should bring in enough revenue to justify employment. Loosely, this can be calculated by dividing the organization’s total revenue by total number of employees. However, this is rather crude calculation that doesn’t factor in things like cost per hire, training costs, etc. As such, more thorough HR reporting needs to be completed to arrive at the true figure.
Profit Per Employee
Beyond revenue, profit per employee should also be measured for effective HR reporting. Calculated by dividing business profit by total number of employees, profit per employee can help you determine if your over or understaffed. For example, the organization may have taken on extra sales staff to improve revenue, but are they really adding dollars to your bottom line, or is increased staffing simply eating into profits?
Cost Per Hire
This measures what you’re paying to recruit and onboard each new employee. The average cost per hire is about $4,000, according to recent studies, but you’ll need to determine precisely what it is at your organization. To do so, you must factor in everything from the costs of an applicant tracking system to man-hours spent interviewing candidates, training, and onboarding costs.
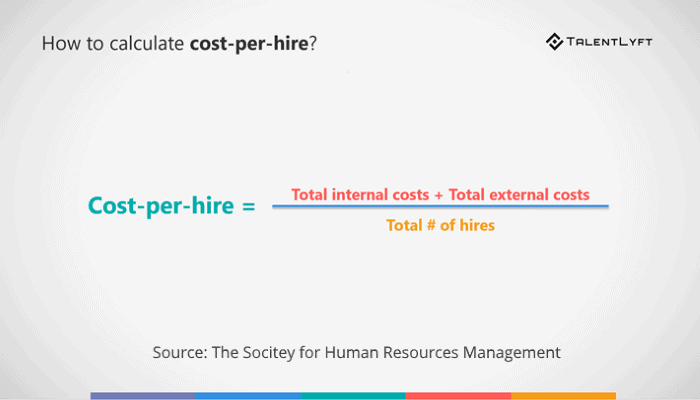
(Image source: talentlyft.com)
Time to Fill
This is the number of days between a position becoming available and a candidate accepting that position. The longer it takes to fill a position, the more money it costs the organization – and the longer the organization suffers in terms of lost productivity.
Training Spend Per Employee
How much are you spending on employee training? Course fees, travel costs, the cost of your learning management system, the time spent administering employee training, productivity losses due to training time – it all adds up, and you need to determine if it’s worth it using the following metric…
Training ROI
Are your training investments paying off? This is not an easy thing to calculate, but training ROI can be worked out by dividing the cost of employee training by the value of increased performance. Performance metrics will of course vary depending on the department the employee hails from. For example, the performance of customer service reps may be measured in terms of number of customer complaints, time spent handling routine issues, etc. Salespeople will of course be measured in terms of sales performance, and marketing in terms of leads generated. Comparing before and after training results will allow you determine whether training is paying off, and thereby whether or not you need a new strategy.
Time to Productivity
This is another important HR reporting metric, for it allows you to determine how long it takes for new hires to reach full productivity. For example, let’s say a fully-productive salesperson generates $1,000 a day in revenue. How long does it take (and how much does it cost) to bring a new hire up to that standard – and how can you shorten that timeframe (and reduce the associated costs)?
Employee Turnover
Another important metric for effective HR reporting – not only for purposes of predicting how many new hires you’ll need to make, but also in determining whether your employees are happy or not. Turnover is at an all-time high, according to a recent report from Salary.com – standing at 19.2% for the average US company. A good goal to strive for would be about half that – with the high costs of new hires, high turnover is expensive.
But not all employee turnover is created equal, of course. As such, turnover should be broken down into revealing categories. What is your involuntary (employer-led) turnover rate, for example, compared to your voluntary (employee-led) turnover rate? And what is your unwanted turnover rate? Not all turnover is negative – such as when bad performers leave. Unwanted turnover rate is the number of good performers that leave, expressed as a percentage of overall performers.
And what about your 90-day and 360-day quit rates? This is the number of new hires that leave within three months or a year. It is of course HR’s job to recruit the right people, and if your HR reporting reveals big 90- and 360-day quit rate percentages, this will be a key indicator that something is going wrong with the recruitment process.
Quality of Hire
This is the percentage of new hires that are given a good rating by their manger during their early performance reviews. Quality of hire is important for HR reporting as it is another indicator of how effective HR is in selecting and recruiting the right candidates. Only by consistently maintaining a high quality of hire will the organization reach its strategic goals.
Employee Satisfaction and Engagement
Both of these metrics can be measured through employee attitude and engagement surveys. Dissatisfaction is a leading cause of employee turnover, while high engagement predicts higher productivity, better customer service, lower turnover, and more.
Absenteeism
Another hugely important metric for meaningful HR reporting. Calculated by dividing an employee’s workdays missed by total workdays scheduled, absenteeism is another measure of employee satisfaction and engagement – unhappy employees take more time off.
Absence Cost
How much is absenteeism costing your company? Loss of productivity, sick pay, replacement costs – what are the figures, and how can they be brought down?
The List Goes On…
The above list is by no means exhaustive. Other HR reporting metrics that must be considered are:
- Internal promotion rates
- Length of service (how long the average employee stays at your organization)
- Health care and benefits costs per employee
- Cost of HR per employee (how much you pay the HR team vs. how many employees you have)
- Above average performance ratio (how many employees are performing at a high level)
- Innovation (number of successful product or process ideas vs. total number of employee suggestions)
- Ghost rate (number of new hires that don’t show up for first day of work)
The list could indeed go on and on – and it all produces valuable data that can be analyzed to reveal those crucial business insights that allow HR to make informed business decisions.
Data-Driven HR
The whole purpose of HR reporting is to enable data-driven HR. HR teams can use real data generated by HR reporting to make better HR decisions, better understand and evaluate the business impact of people, make HR processes more effective and efficient, and improve the overall wellbeing and effectiveness of the organization’s employees. All of this can have a huge impact on a company’s ability to achieve its strategic goals – which is precisely why HR reporting is so valuable.
However, data-driven HR requires specialized tools – HR analytics and HR dashboard tools that allow teams to visualize HR data and use it to predict the future (such as when employees might be at risk of quitting) and take action.
One such tool is Klipfolio – a cloud-based business dashboard application that makes critical HR data accessible and visible, with all information updated constantly for real-time accuracy. Klipfolio allows HR departments to build fully-customizable dashboards, enabling users to collect, view, and analyze the information they need to make better business decisions. For example, the HR Leadership and Performance Development Dashboard can be customized to provide a real-time interactive view of department structures, and track mentors, succession plans, and professional development.
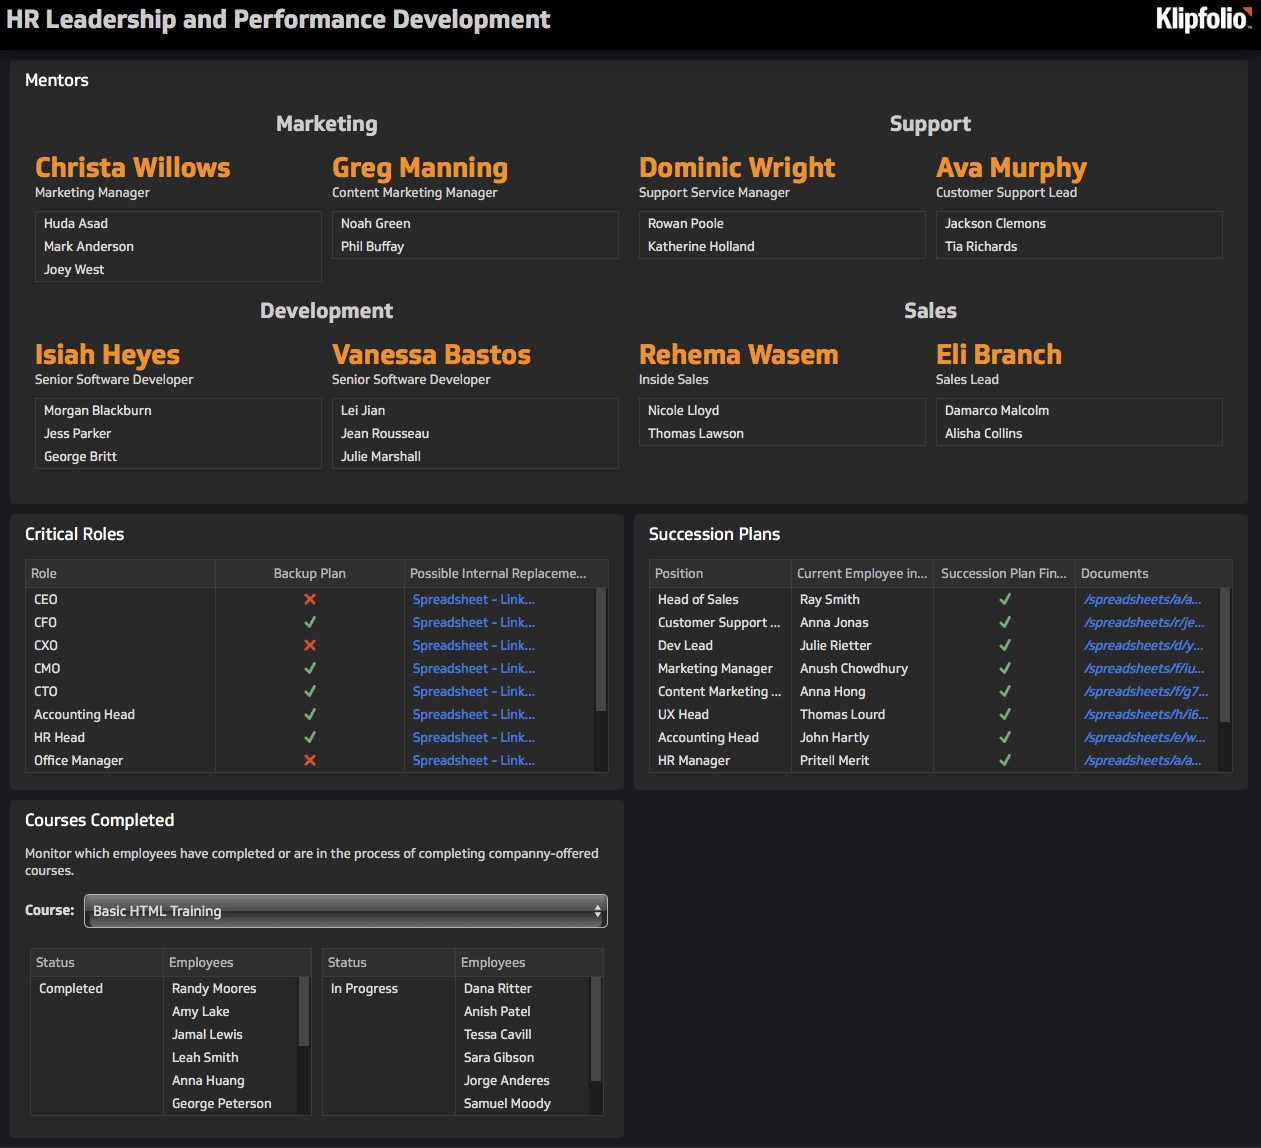
(Image source: app.klipfolio.com)
Other HR dashboard solutions include Tableau for HR and Looker, both of which make it easy for HR teams to visualize HR data and make informed business decisions from it.
Here’s Michael Thurston, former HR analyst at Intermountain Healthcare, talking about how adopting Tableau’s HR Analytics solution helped the organization identify opportunities and improve the value of its HR department.
<iframe width=”560″ height=”315″ src=”https://www.youtube.com/embed/ZJOu2i0FM1M” frameborder=”0″ allow=”accelerometer; autoplay; encrypted-media; gyroscope; picture-in-picture” allowfullscreen></iframe>
(Video source: youtube.com)
Final Thoughts
Effective HR reporting using powerful HR analytics tools gives HR the invaluable ability to not only describe what has happened, but predict what will happen in the future. And this is what makes HR reporting so crucial – it provides the insights needed to make informed business decisions and drive performance across the whole organization. Tracking the right metrics is the first step – and for different companies, different data will be relevant – and using the right tools to make sense of it all is the second. HR dashboards are crucial for realizing the full potential of HR reporting – with intelligent, data-driven HR, opportunities for HR teams to add more value to the organization open up. Data, indeed, is one of the most valuable assets at HR’s disposal today, and HR teams everywhere need to start doing more with it.
HR Reporting
HR reports provide both quantitative and qualitative information on employees, HR practices, and company trends – and this information is vital for informed decision making. Regular HR reporting enables both HR and management to keep their fingers on the organization’s pulse by tracking key workforce metrics. For example, the sales department may be struggling with high turnover rates or high time-to-hire rates, indicating that more emphasis needs to be placed on retaining employees. With HR reporting, new trends and opportunities can be spotted early on, and emerging problems can be addressed before they significantly impact the business. HR Reporting – What Metrics Should Companies Be Tracking? Revenue per employee. Cost per hire. Time to fill. Traning spend per employee. Training ROI. Time to productivity. Employee turnover. Quality of hire. Employee satisfaction and engagement. Ansenteeism. Absence cost and so many others.