It’s been an industry buzzword for well over a decade, is described as the new gold rush for businesses, and has even entered the mainstream public lexicon – but what is big data?
Well, the short answer is that it’s simply lots of data. Lots and lots (and lots and lots) of data, actually. And we’re not just talking about a few gigabytes or even terabytes here. When talking about this from a business perspective, we’re wading around in petabytes (1,024 terabytes) and exabytes (1,024 petabytes) of the stuff. Maybe even more than that, depending on the size of the business.
Where does all this data come from? From us, of course. From consumers, working professionals, and the machines and software we use to live our lives and go about our work. Every time we make a purchase, book a holiday, browse the web, mess about on social media, send an email, launch a marketing campaign or write a blog post, we’re generating data. And since there is now more than 7.7 billion of us knocking around the planet, the amount of data we’re generating even on a daily basis is quite simply astronomical. In fact, by 2020, it’s estimated there will be around 40 trillion gigabytes (40 zettabytes) of data out there in cyberspace – and that data has big value for businesses that can analyze and extract insights from it.
Big Data Examples
Of course, businesses aren’t concerned with every single little byte of data that has ever been generated. Even if they were, the fact of the matter is they’d never be able to even collect and store all the millions and billions of datasets out there, let alone process them using even the most sophisticated data analytics tools available today. This is in part due to the sheer quantity of data that’s in existence right at this very moment – but also because data is growing exponentially all the time.
Let’s consider some real-world examples to gain a sense of just how much data an organization might have to store and analyze on a daily basis.
Raconteur recently published an infographic which gives us a glimpse of the new data reality. Pulling out some highlights, each day:
- 500 million tweets are sent
- 294 billion emails are sent
- 4 petabytes of data are created on Facebook
- 4 terabytes of data are created from each connected car
- 65 billion messages are sent on WhatsApp
- 5 billion searches are made
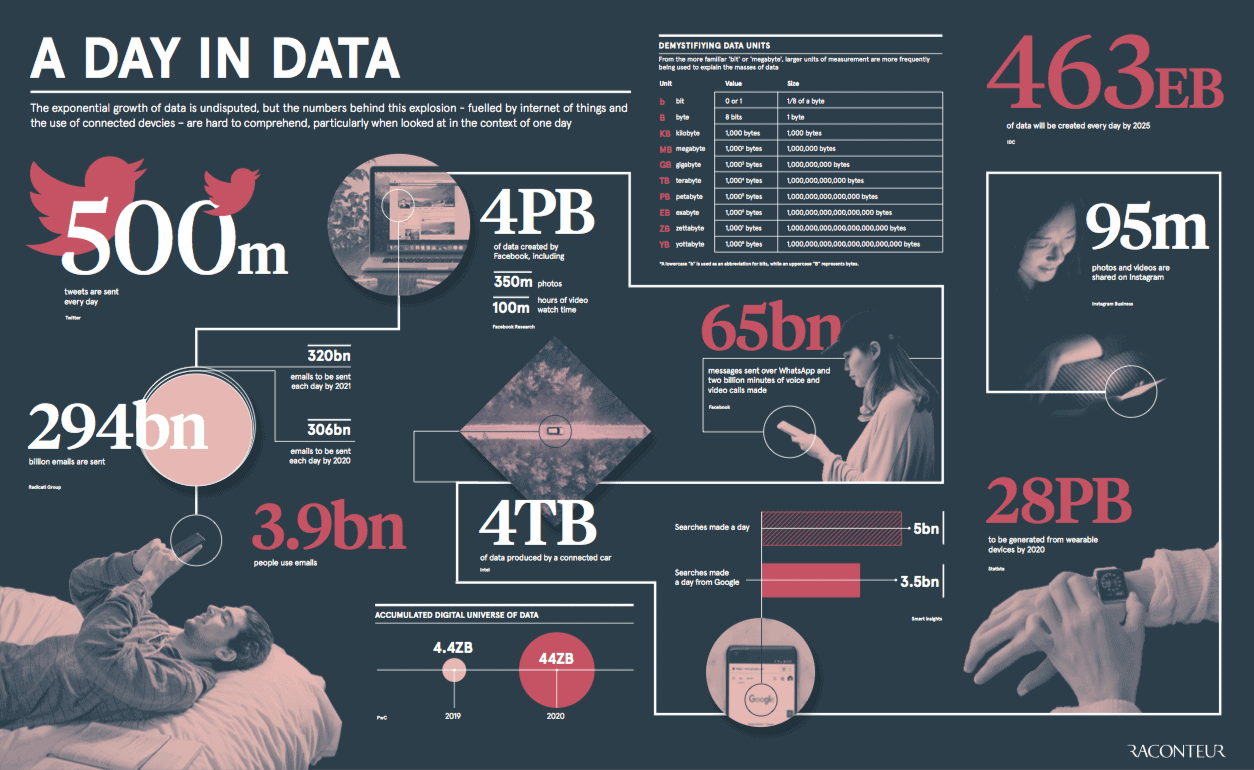
(Image source: raconteur.net)
Characteristics of Big Data – The 4 Vs
So, we’ve established that this involves lots and lots of data. But is this an adequate definition? After all, what one business considers to be “lots” may just be a pretty standard dataset in another business’s eyes.
For some, it’s not necessarily size that matters at all – rather, they define it as any type of data that’s distributed across multiple systems. And that’s not a bad way to think about it. Naturally, distributed systems generate more data than localized ones due to the fact that there tends to be more machines, services and applications in distributed systems – all of which generate more logs containing more data.
But distributed systems don’t necessarily involve a lot of data. For example, a small 3-man startup mounting a handful of 500-gigabyte laptop computers over an office network would technically be creating a distributed data environment – but nobody could sensibly describe this as an example of big data.
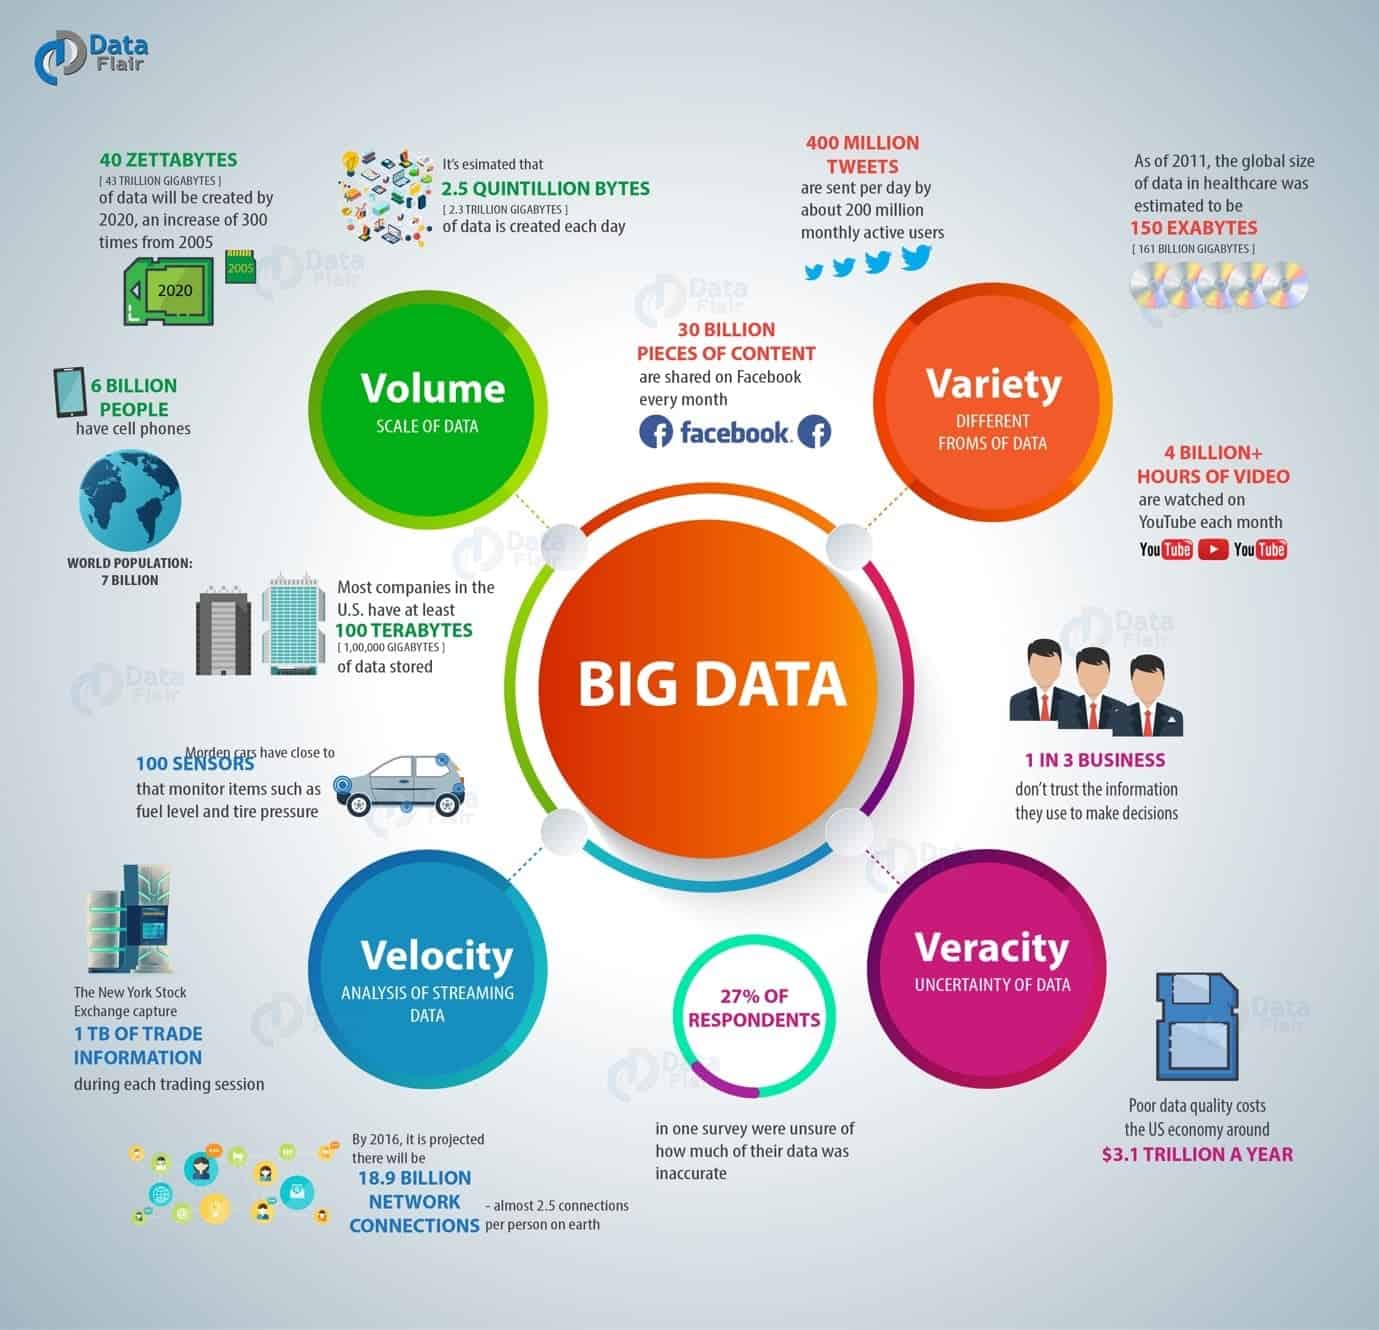
So, what is big data? While there is no “official” definition, the main characteristics are commonly referred to as the four Vs – Volume, Velocity, Variety, and Veracity. In the business world, these are the high-level dimensions that data analysts, scientists and engineers use to break everything down – and when you’ve got the four Vs, you know you’re dealing with big data (as opposed to regular data (or “little data”, perhaps)).
Volume
First up is volume. Unsurprisingly, the main characteristic that makes any dataset “big” is the sheer size of the thing. We’re talking about datasets that stretch into the petabytes and exabytes here. These huge volumes require powerful processing technologies – much more powerful than a regular laptop or desktop processor. As an example of a high-volume dataset, think about Facebook. The world’s most popular social media platform now has more than 2.2 billion active users, many of whom spend hours each day posting updates, commenting on images, liking posts, clicking on ads, playing games, and doing a zillion other things that generate data that can be analyzed. This is high-volume big data in no uncertain terms.
Variety
Facebook, of course, is just one source of big data. Imagine just how much data can be sourced from a company’s website traffic, from review sites, social media (not just Facebook, but Twitter, Pinterest, Instagram, and all the rest of the gang as well), email, CRM systems, mobile data, Google Ads – you name it. All these sources (and many more besides) produce data that can be collected, stored, processed and analyzed. When combined, they give us our second characteristic – variety.
Variety, indeed, is what makes it really, really big. Data scientists and analysts aren’t just limited to collecting data from just one source, but many. And this data can be broken down into three distinct types – structured, semi-structured, and unstructured.
Structured data is comprised of clearly-defined data types that are well organized and can be easily searched – things like airline reservation systems, lists of customer names and account histories, or just simply spreadsheets are all examples of structured data. Unstructured data, by comparison, is unorganized. Things like text and multimedia content – videos, images, social media posts, instant message communications – are all examples of unstructured data. Though such things do have internal structure, the data is nonetheless dispersed, disordered, and difficult to search – hence, unstructured. Semi-structured data sits somewhere in between – it does not conform with the formal structure of structured data, but nonetheless contains tags or other markers to make it slightly more searchable. Email is an example of semi-structured data – there is often metadata (i.e. data about data) attached to emails within a database, making it more structured than unstructured data, but less so than structured.
One of the primary goals of analytics is to use technology to make sense of unstructured and semi-structured data, and combine it with what’s known from structured datasets in order to unlock insights and create business value.
(Image source: dzone.com)
Velocity
Huge volumes of data are pouring in from a variety of different sources, and they are doing so at great speed, giving us our third characteristic – velocity. The high velocity of data means that there will be more data available on any given day than the day before – but it also means that the velocity of data analysis needs to be just as high. Data professionals today don’t gather data over time and then carry out a single analysis at the end of the week, month, or quarter. Rather, the analysis is live – and the faster the data can be collected and processed, the more valuable it is in both the long and short term. Facebook messages, Twitter posts, credit card swipes and ecommerce sales transactions are all examples of high velocity data.
Veracity
Veracity refers to the quality, accuracy and trustworthiness of data that’s collected. As such, veracity is not necessarily a distinctive characteristic of big data (as even little data needs to be trustworthy), but due to the high volume, variety and velocity, high reliability is of paramount importance if a business is draw accurate conclusions from it. High veracity data is the truly valuable stuff that contributes in a meaningful way to overall results. And it needs to be high quality. If you’re analyzing Twitter data, for instance, it’s imperative that the data is extracted directly from the Twitter site itself (using the native API if possible) rather than from some third-party system which might not be trustworthy. Low veracity or bad data is estimated to cost US companies over $3.1 trillion a year due to the fact that bad decisions are made on the basis of it, as well as the amount of money spent scrubbing, cleansing and rehabilitating it.
The Fifth V – Value
Don’t be fooled into thinking that the fifth V quit the band before the others became famous, for indeed this final V – value – is the most important of all, and without it, all else means nothing.
Value sits right at the top of the pyramid and refers to an organization’s ability to transform those tsunamis of data into real business. With all the tools available today, pretty much any enterprise can get started with big data – but it’s far too easy to get swept along with the hype and embark on initiatives without a clear understanding of the business value they will bring.
So, what is the real value? Why is data the new gold? The simple answer is that data enables businesses to get closer to their customers, to understand their needs and preferences better so they can optimize products, services, and operations. Think about the product recommendations made by Amazon creating all those up-sales opportunities – that’s the value. Or take Uber – the company is able to optimize its processes and operations through the analysis of data. It can predict demand, create dynamic pricing models, and send the closest drivers to customers.
And there’s value to be found in other industries too. Government agencies and healthcare organizations can predict flu outbreaks and track them in real time, while pharmaceutical companies can use big data analytics and insights to fast-track drug development. Data analytics is also used to combat cybercrime, to improve recruitment, to enhance education resources in universities, and to streamline supply chains.
What Is Big Data Analytics?
The final question to answer is how do we extract value from it? The important thing to realize here is that the data isn’t valuable in and of itself – rather the value lies in the big insights that can be drawn from it. This means analytics, which is the complex process of examining large and varied datasets to unearth high-value information such as market trends, customer preferences, hidden patterns and unknown correlations that help enterprises make informed business decisions.
Driven by specialized analytics software and high-powered computing systems, big data analytics enables data analysts and scientists to analyze growing volumes of structured, unstructured and semi-structed data from a variety of sources to open up a wide range of business benefits. These benefits include new revenue opportunities, improved operational efficiency, more effective and personalized marketing campaigns, better customer service and much more besides.
There are essentially four kinds of analytics – descriptive, diagnostic, predictive, and prescriptive. Descriptive analytics tells organizations what happened in the past – how many sales were made during a given week, for instance. Diagnostic analytics is about measuring historical data to understand why something happened – why there was a spike in sales during that week. Predictive analytics is even more valuable still, telling companies what’s likely to happen in the future – which week next month will likely generate high sales volumes. Finally, prescriptive analytics literally prescribes what action to take to either eliminate a future problem or take full advantage of a promising trend – make sure you’re flushed with stock and additional staff during that week next month to cater for the spike in demand.
Prescriptive analytics is where big data and machine learning algorithms come into play. It is about predicting outcomes based on numerous variables and determining courses of action to gain a completive advantage going forward. It requires not only historical information, but also external data from a variety of unstructured sources to make informed business decisions. It is within predictive and prescriptive analytics where the real big nuggets of gold are buried.
(Video source: youtube.com)
Final Thoughts
In sum, big data is data that is huge in size, collected from a variety of sources, pours in at high velocity, has high veracity, and contains big business value. Importantly, in order to extract this value, organizations must have the tools and technology investments in place to analyze the data and extract meaningful insights from it. Powerful data analytics makes processes and operations more efficient and enables organizations to manage, discover, and utilize knowledge. So, get out there and start collecting data – but then make sure you invest in the technology and the people who can connect, analyze, and extract value from it. Only this way will you realize the fifth V and keep your company competitive in the future.
Characteristics of Big Data
Well, the short answer is simply lots of data. When talking about big data from a business perspective, we’re wading around in petabytes (1,024 terabytes) and exabytes (1,024 petabytes) of the stuff. Maybe even more than that, depending on the size of the business. Where does all this data come from? From us. From consumers, working professionals, and the machines and software we use to live our lives and go about our work. Every time we make a purchase, book a holiday, browse the web, mess about on social media, send an email, launch a marketing campaign or write a blog post, we’re generating data. And since there are now more than 7.7 billion of us, the amount of data we’re generating even on a daily basis is quite simply astronomical. In fact, by 2020, it’s estimated there will be around 40 trillion gigabytes (40 zettabytes) of data out there in cyberspace – and that data has big value for businesses that can analyze and extract insights from it. The four characteristics of big data are Volume (the main characteristic that makes any dataset “big” is the sheer size of the thing), Variety (what makes big data really, really big. Data scientists and analysts aren’t just limited to collecting data from just one source, but many. And this data can be broken down into three distinct types – structured, semi-structured, and unstructured), Velocity (high velocity of data means that there will be more data available on any given day than the day before), and Veracity (this refers to the quality, accuracy, and trustworthiness of data that’s collected.