Metrics, metrics, metrics. Marketing is obsessed with figures. And it needs to be. After all, successes (and failures) are measured in numbers. Traffic, followers, social media likes, page views, click-through-rates, video views, etc., etc., etc. – they all get turned into marketing reports, and, so long as the numbers are going up, marketing can pat itself on the back and feel happy that it’s doing a good job, right?
Not so fast.
There’s a problem to this logic, and it comes down to the content of these marketing reports – i.e. what’s being measured, and why.
Vanity Metrics
Some numbers are easier to grow than others – and often, the easier it is to improve a certain metric, the least valuable it is. Let’s say, for instance, that you were averaging 5,000 website hits per month before Christmas. Then, you began the New Year by launching a new promotional video on social media – and, lo and behold, you enjoyed a traffic increase. 5,500 hits in January, 6,000 in February, all bolstered by a tidy little increase in Twitter followers and Facebook Likes.
Not too shabby, marketing thinks to itself as it piles the figures into a marketing report. “Look, Boss. All these graphs are going up and to the right. Our new video campaign is really delivering results!”
But what does 6,000 website hits really mean? What does a 100 Facebook Likes really tell you? Your video has been viewed 15,000 times on Twitter? Wow-wee – can we all retire now?
Of course not. In isolation, these figures don’t really illuminate anything of any real value at all – and it reminds me of the cautionary joke about many a modern marketing model (apologies if you’ve heard it before). It goes like this:
A million people walk into a bar. No one buys anything. The bar is declared a lavish success.
It’s a good joke because it highlights the problem of marketing reports that focus on the wrong metrics. Social media followers, video views, page visits, subscribers – they all mean nothing unless someone actually buys something. Yes, growing metrics for brand awareness and market reach is important, but only to the extent that they quantifiably connect to what really matters to your business’s bottom line – new customers, revenue, and profit. In the end, it actually doesn’t matter how many people visit your website because you don’t make money off website visitors. Or Twitter followers or YouTube subscribers. In isolation, video views and Facebook likes, etc., are vanity metrics – nothing more.
Actionable Metrics – What Marketing Reports Should Be Focusing On
Vanity metrics may make for positive-looking marketing reports, but offer nothing in the way of meaningful context for making future business and marketing decisions.
So – what should marketing reports focus on instead? Short answer – actionable metrics and outcome metrics. But what are these?
Well, actionable metrics are the ones that connect marketing efforts to actual revenue – such as campaign spend to new customers acquired. This metric, in fact, is particularly important, as even “customers acquired” can be a vanity metric if you don’t know how much those acquisitions cost. As Crazy Egg aptly puts it, you could be growing a huge customer base and going broke at the same time – and you wouldn’t be the first, and you certainly won’t be the last.
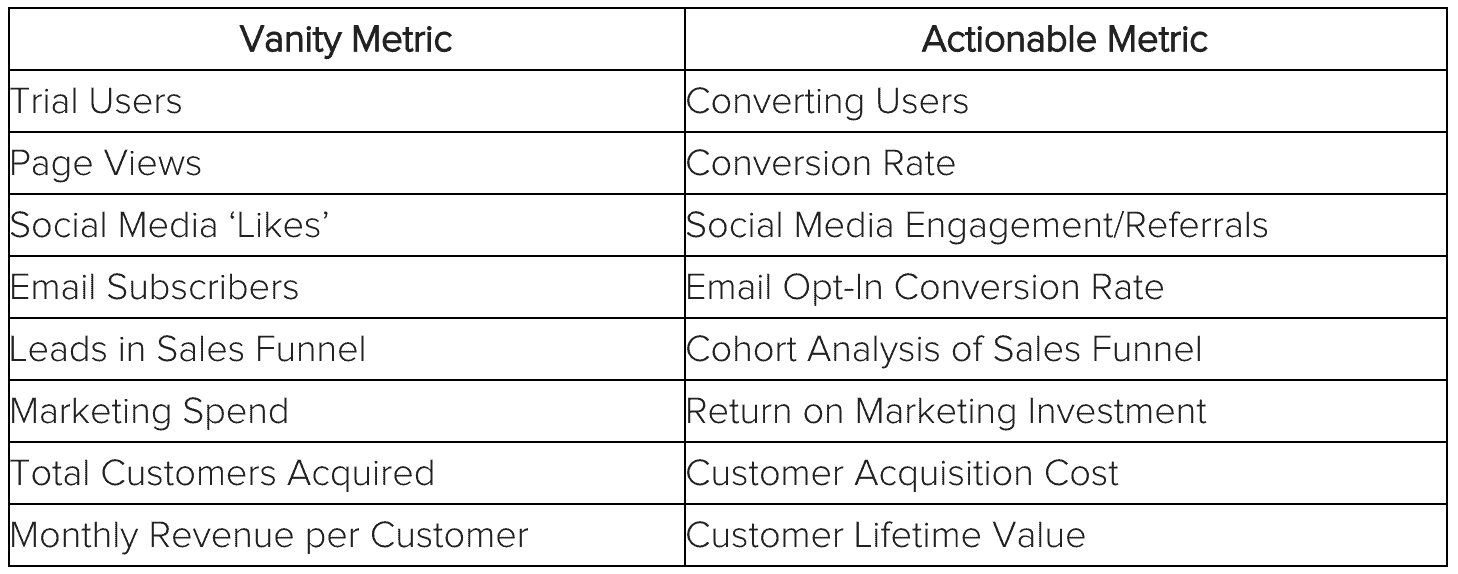
(Image source: crazyegg.com)
The important thing with actionable metrics is that they tell you something important about what’s happening in your business. They link directly to business success, and reveal precisely what you’re doing right and wrong – what’s working and what’s not – at each stage of your marketing and sales funnel.

(Image source: marketo.com)
Leading marketing automation software company Marketo outlines eight essential marketing reports that marketers should focus on to keep track of the actionable, outcome and performance metrics that actually matter – the metrics that actually help marketing teams optimize campaigns and drive better business decisions.
Let’s run through what they are.
- ToFu Lead Analysis
Top-of-the-Funnel (ToFu) metrics are the first metrics marketers should be using to evaluate the effectiveness of a campaign in a marketing report. Actual sales opportunities (i.e. leads who have been accepted by the sales team and are being actively worked on) take a while to develop – but you don’t get opportunities without ToFu leads. For this marketing report, focus on measuring campaign investment, percentage of new names (contacts) acquired, total targets, investment per target, and average demographic score.
ToFu lead analysis helps marketers answer questions like:
- Which campaigns or programs bring in targets or leads most cost-effectively?
- Where are we exhausting our email lists?
- Which initiatives are bringing in the most highly-qualified leads?
- MoFu Opportunity Analysis
As ToFu leads are nurtured into opportunities, the next marketing report to focus on concerns Middle-of-the-Funnel (MoFu) opportunity analysis to determine which marketing programs are worth the investment. The metrics to track include the following:
- Program costs and successes
- New names
- Investment per opportunity created
- Pipeline created
- Revenue won
- Pipeline to cost
- Opportunities won
- Investment per opportunity created
Knowing these figures allows marketers to answer the following questions:
- Which programs created the most opportunities for the investment?
- Which programs required the least investment per opportunity?
And the inverse of each.
- Program Channel Performance
Which channels are best for creating leads, targets, and opportunities? Analyzing channel performance allows you to determine whether it’s email, eBooks, webinars, tradeshows, or any other channel that’s driving success. The marketing report should reveal precisely how many targets you’ve created per channel, as well as cost per target, percentage of targets who become opportunities, and the number of days it takes to create opportunities. This information can then be used to inform your channel tactics going forward.
- Vendor/Channel Comparisons
If you’re running multiple paid programs, you’ll need additional insight into how different vendors compare to one another. For this stage, marketers should create a marketing report where paid program vendors are examined side-by-side, consolidating the data across vendor and channel to create a clearer picture as to which vendors to keep using, and which aren’t delivering return on investment (ROI).
Marketo provides an example of how this looks:
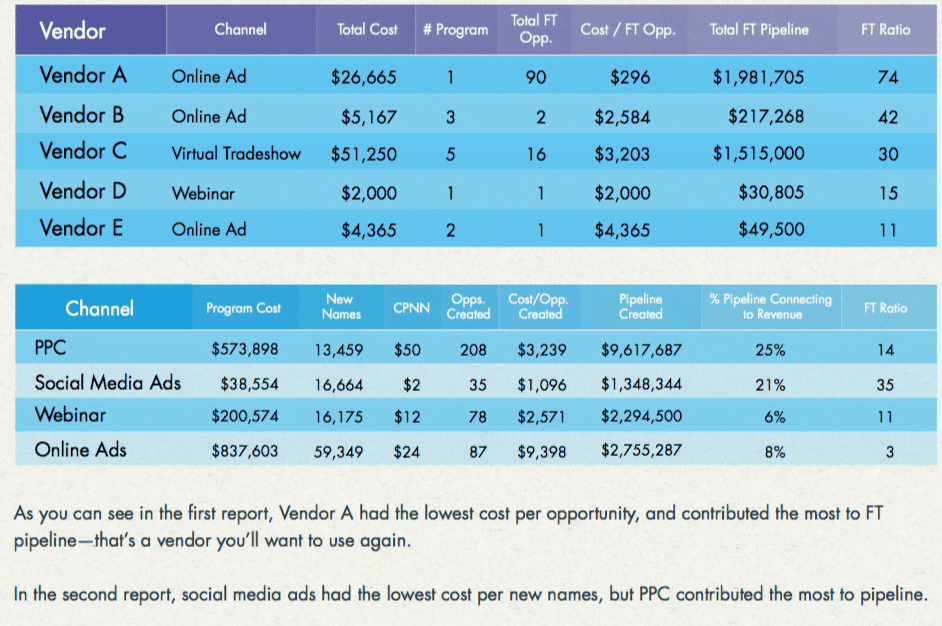
(Image source: marketo.com)
- Content Program Performance
When running paid programs, you will be able to send content to leads in the vendor’s database – leads who fit your specific criteria, but aren’t already in your own contact/email list. Of course, certain content works best with certain audiences – but you don’t want to be wasting money sending content to people that don’t engage. As such, you’ll need to be creating a marketing report that reveals precisely what content offers are working best across all your paid programs with specific vendors, and make adjustments to your strategy accordingly.
- Content Impact
Content marketing, of course, isn’t just reserved to paid channels. As such, you’ll need to be creating marketing reports that measure the impact of your content across all of your marketing efforts. The report should tell you which content is driving prospects to become customers, and thereby help you plan your next round of content assets.
- Opportunity Influence
According to Marketo, in B2B sales, a typical buying committee has between five and 21 people – that’s a lot of people that marketers have to reach. However, some of these opportunities have more influence in the boardroom than others – if the CEO has downloaded eBooks, visited your blog, and attended a webinar, you know that you’ve got an important decision-maker interested. Creating marketing reports that track opportunity influence helps determine how many “touches” marketing has made with key decision-makers, which in turn provides a clearer picture of how marketing investments lead to sales.
- Pipeline to Investment
Finally, to get a true understanding of all of your marketing programs, you’ll need to create marketing reports that track the investment into – and opportunities created from – each channel. In addition, the report should track your pipeline-to-investment ratio – i.e. pipeline divided by investment – so you can clearly see your pipeline’s ROI across vendors and channels.
Final Thoughts
Tracking vanity metrics that make you feel good but don’t tell you anything is a bad idea in business. Instead, marketers need to create marketing reports that track metrics that tell you things you actually need to know about your business and marketing. These are your outcome, actionable and performance metrics, which, when analyzed properly, will allow you to make smart decisions that demonstrably lead to better ROI, more customers, more revenue, and more profits. Vanity metrics are a meaningless distraction from optimizing your marketing efforts for true business success – ditch them today, and start focusing on what really matters for your company.
Vanity Metrics
Some numbers are easier to grow than others – and often, the easier it is to improve a certain metric, the least valuable it is. Vanity metrics may make for positive-looking marketing reports, but offer nothing in the way of meaningful context for making future business and marketing decisions. Actionable Metrics – What Marketing Reports Should Be Focusing On. Actionable metrics are the ones that connect marketing efforts to actual revenue – such as campaign spend to new customers acquired. This metric, in fact, is particularly important, as even “customers acquired” can be a vanity metric if you don’t know how much those acquisitions cost. The important thing with actionable metrics is that they tell you something important about what’s happening in your business. They link directly to business success, and reveal precisely what you’re doing right and wrong – what’s working and what’s not – at each stage of your marketing and sales funnel.